| Warning |
|---|
This page refers to functionality that has been removed from License Statistics. Reports have been restructured and reorganized as of License Statistics v6.14. The contents of the Denials report have been moved to Features - History - Denials. |
The Denials page under the Features section in the left navigation pane lets you see information about denials. Denials occur when the number of checkout requests exceeds the number of available licenses, resulting in an inability for users to check out a license.
You can easily see how many license checkout requests were denied and how often the denials took place by importing the Denied Requests Log. License Statistics also lets you see the users currently unable to check out a license by delivering information about Realtime Denials.
When you view the history for servers that were added to License Statistics by importing denied request logs, you can see the denied requests for the currently selected feature.Denied Requests pages show the total number of denials per month and detailed statistics on denied license requests for LM-X License Manager, FLEXlm/FlexNet, IBM LUM and Reprise License Manager (RLM) servers. See Denied Requests Log for more information about importing denied request logs. 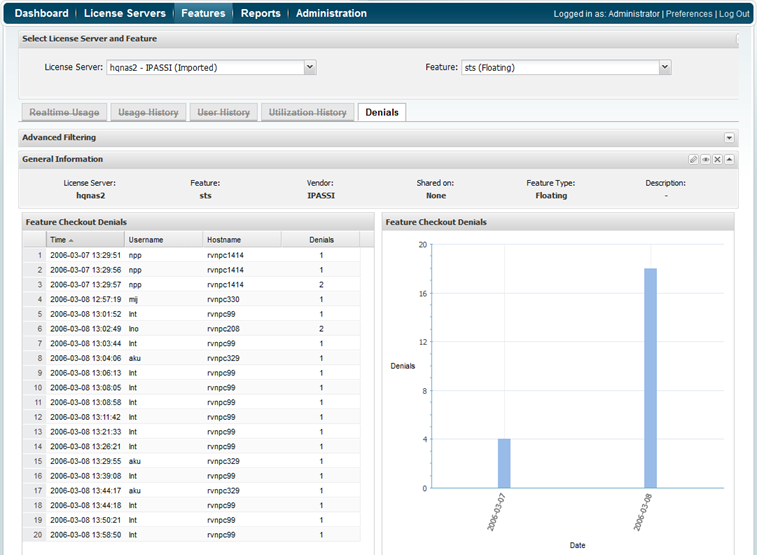
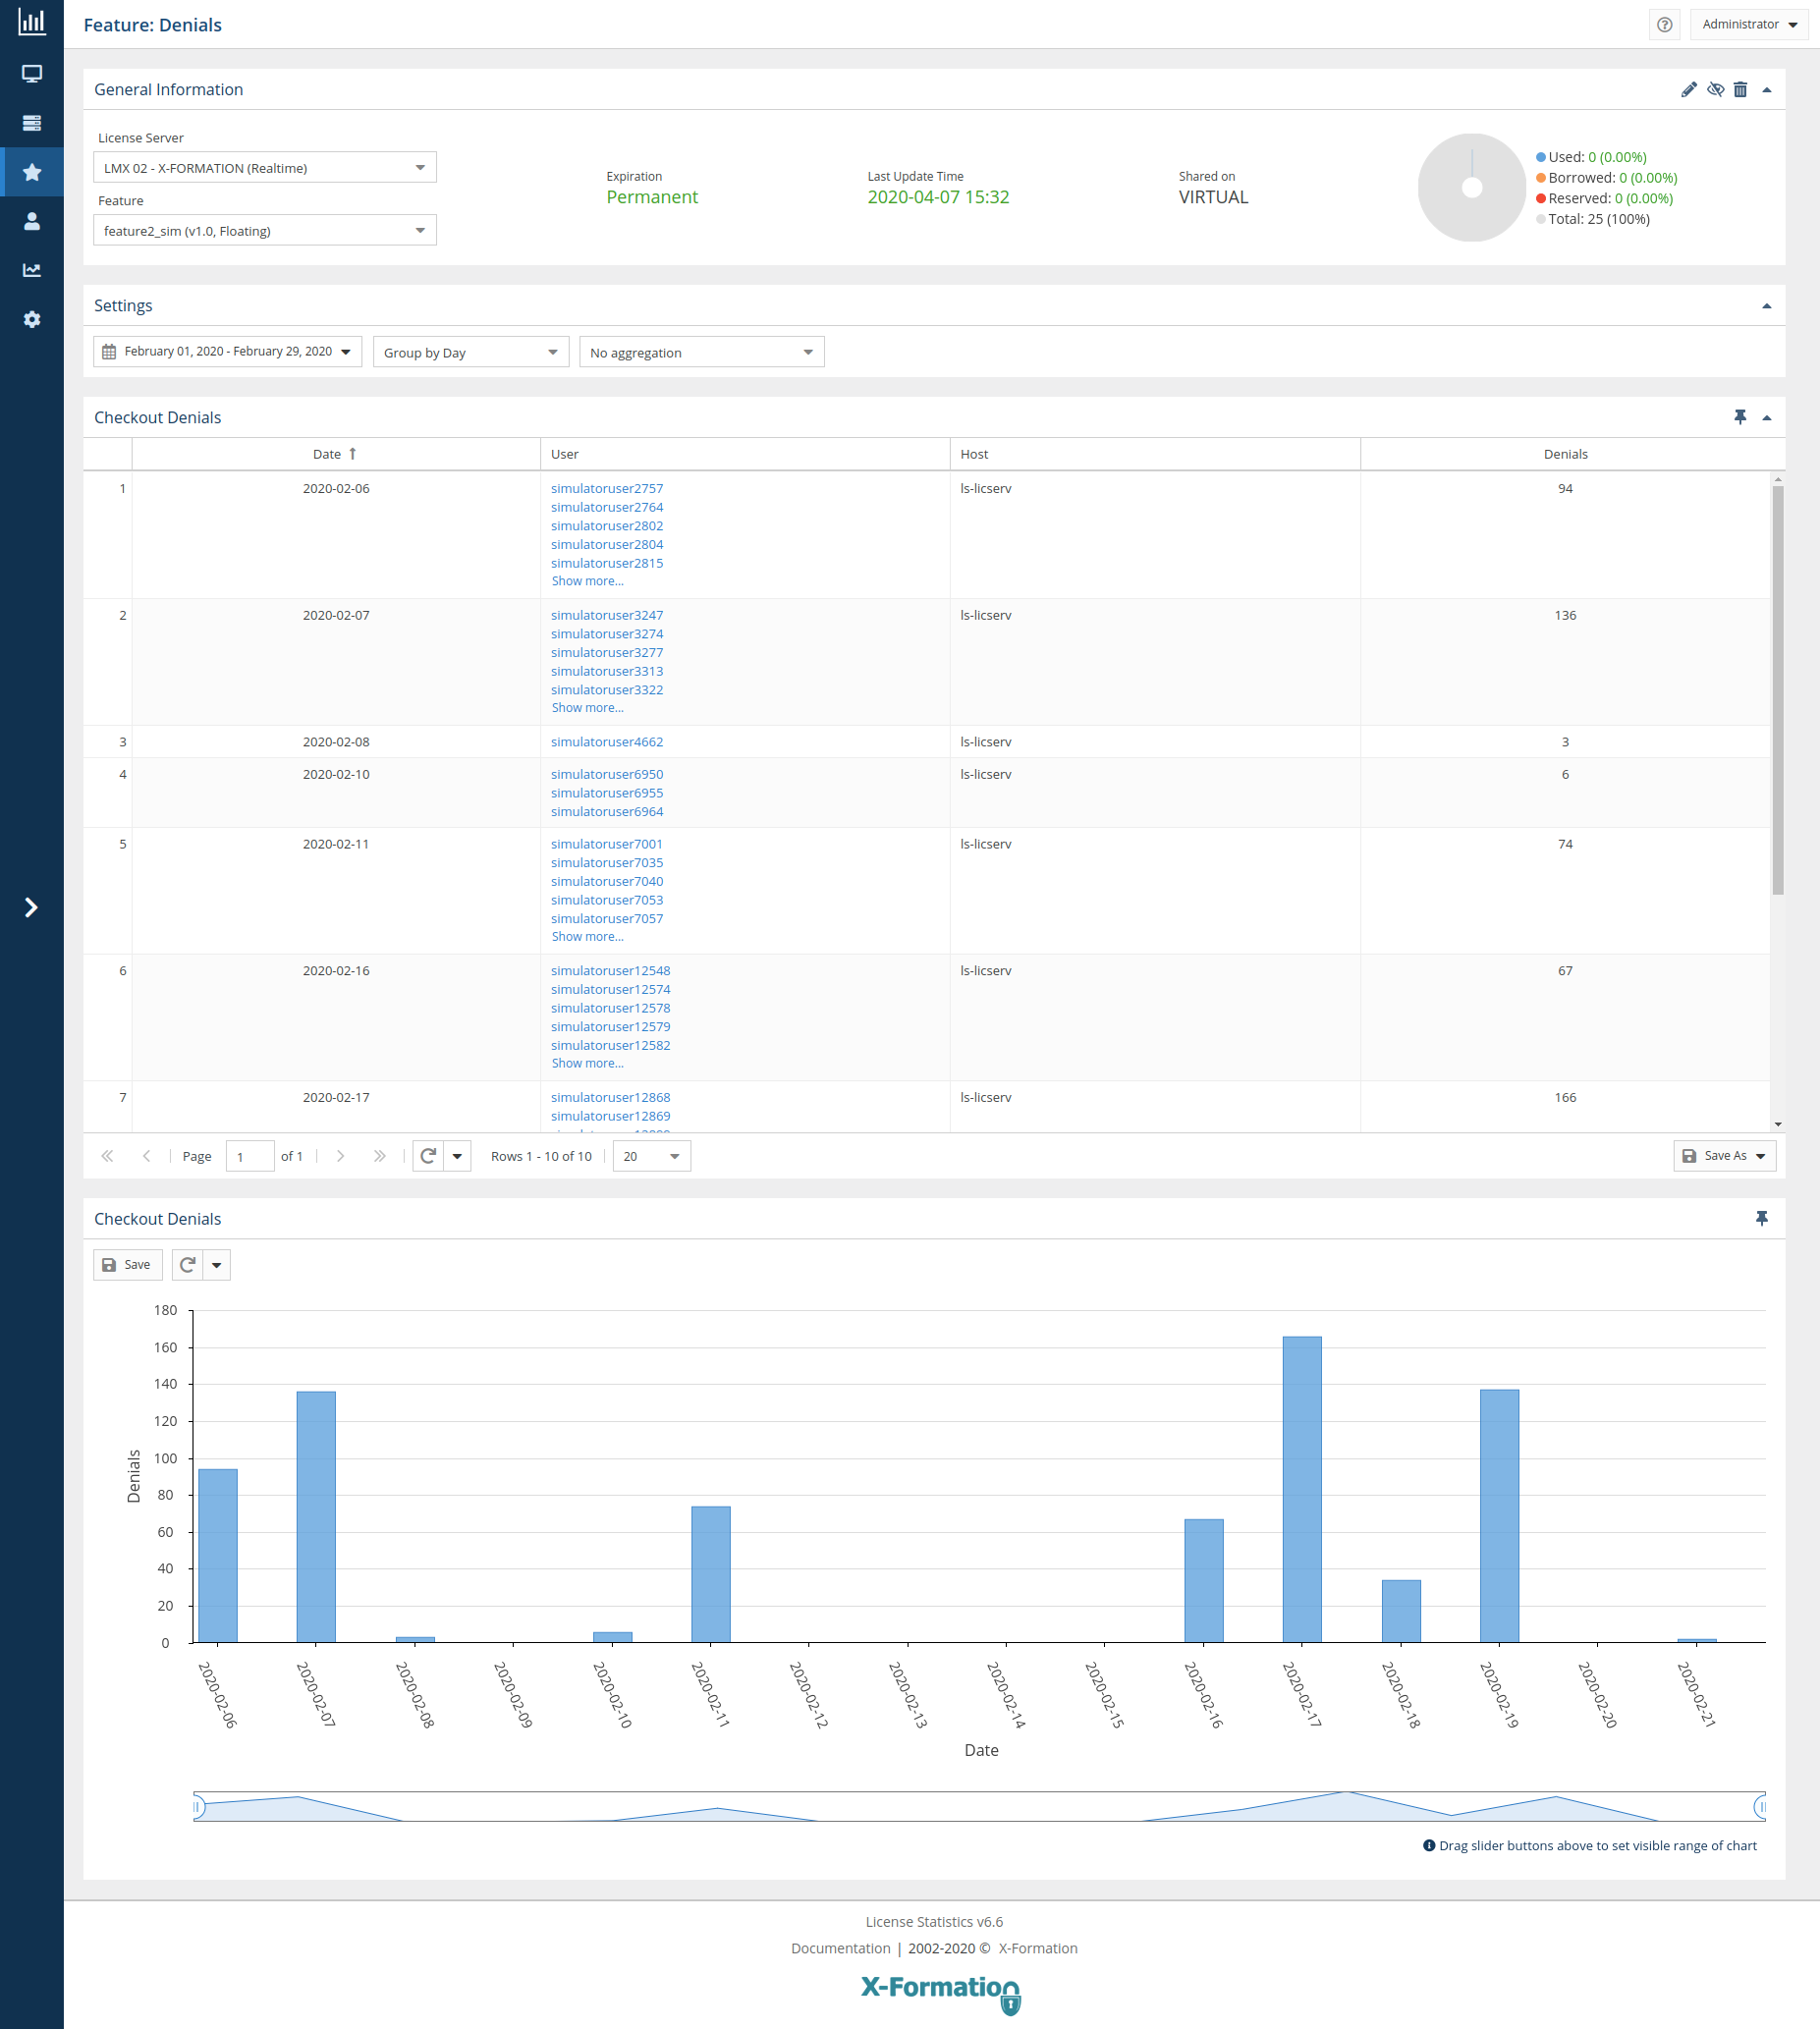
General Information
The General Information area at the top of the page includes identifying information for the feature, including the last update time. You can edit the feature details by clicking the Edit icon on the right end of the General Information title bar.
...
a share code if sharing is in use (for example, "Shared on: HOST"), and the license type.
You can select individual license servers/features to view data for, or choose to view data for all license servers/features.
Checkout Denials grid
The Feature Checkout Denials grid shows the user name User and host name Host for each denial and the time the denial took place.
Feature Checkout Denials graph
The Feature Checkout Denials graph helps you see which days throughout the month the denials were most frequent. For example, the graph above shows that denials were lowest on the 5th of the month, and were at their highest on the 6th.
Filtering results
The data is presented in a grid format and as a chart, making it easy to quickly understand and analyze information you need.
You can adjust the settings to include only the results that are important to you by choosing the dates and the time periods (hour, day, week, month, or quarter) by which denials are grouped from the Settings panel. You can also aggregate by License Server, Feature, Username, or Hostname.
You can add the Checkout Denials grid and chart to the License Statistics Dashboard. Learn more about customizing the DashboardYou can choose the time interval and date range to include in results from the Advanced Filtering area.