...
The information on this page refers to License Statistics v5v6.100 and newer, which added the ability to select a Time Interval when filtering resultsintroduced a new user interface (UI). If you are running using a version previous version of License Statistics, please refer to the documentation relative to your version: v5.2 documentation; v4.17 documentation; v4.8 documentation; v3.12 documentation; v3.11 documentation; v3.10 documentation.to v6.0, see documentation for previous versions. |
The Usage History page under the Features section in the left navigation pane From the Features page, the Usage History tab shows statistics for license usage during any period that usage was tracked. In addition, you can see monthly percentage of use under the Utilization History tab. The settings you make on this page (for example, filters) are retained for the next time you log into License Statistics.
General Information
The General Information area includes identifying information for the feature and a summary of usage information, including a current count of licenses used, borrowed and reserved, the total licenses available, the feature's expiration date, utilization percentage, and a share code if sharing is in use (for example, "Shared on: HOST").
To choose the feature for which to view statistics, use the License Server and Feature pick lists in the Select License Server and Feature section General Information area at the top of the page. You can select either an individual license server or a license server group from the License Servers pick list. After selecting the license server/license server group, the Feature pick list will then contain all features within that license server/license server group for you to choose from. To compare multiple usage history reports, see Usage History Comparison report.
General Information
The General Information area includes identifying information for the feature and a summary of usage information, including a current count of licenses used, borrowed and reserved, the total licenses available, the feature's expiration date, utilization percentage, and a share code if sharing is in use (for example, "Shared on: HOST").
Filtering results
The Settings panel, on the left-hand side of the grid, lets you filter results.
Filtering results by date range
Filtering results
The Settings panel above the grid lets you filter results.
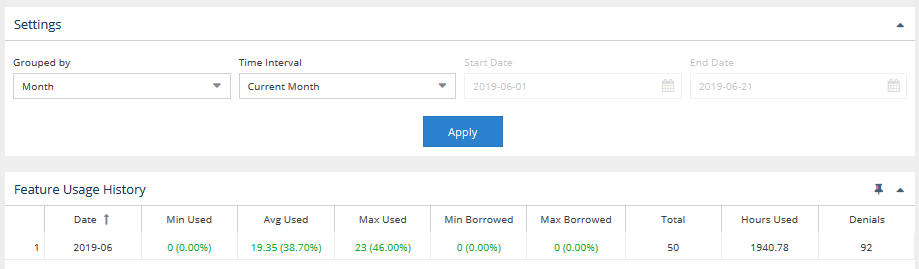
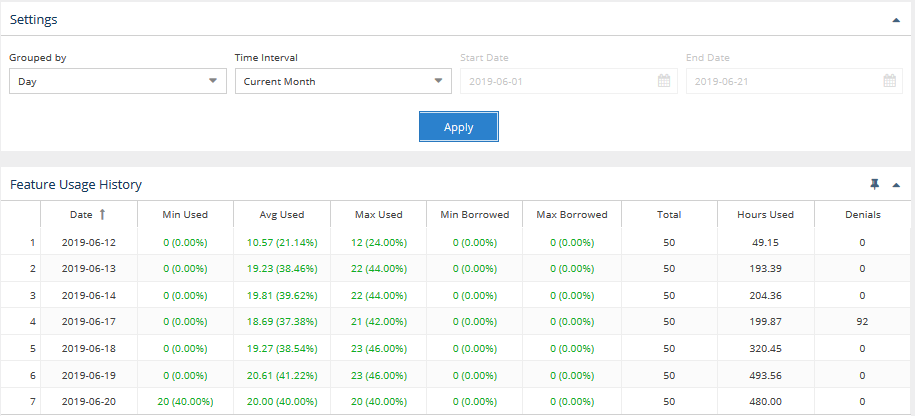
Grouped by setting
You can control how much detail is shown for license usage by setting the Grouped by option to:
- Quarter
- Month
- Week
- Day
- Hour
For example, when set to group information by Month, the report will limit the details to the total usage per feature for the month, as shown in the following example.
When set to group by day, details are expanded to show usage for each day in the month, as shown in the following example.
Time Interval setting
The Time Interval options let you specify Under Date Range, you can choose the time interval to include in the results. The time interval can be:
- Current or Last Year
- Current or Last Quarter
- Current or Last Month
- Current or Last Week
- Today
- Yesterday
- Custom (which lets you enter a specific start and end date)
Grouping data by time period
You can group the data by hour, day, week, month, or quarter regardless of the time interval you select, because the fields aren't interrelated. For example, if you choose to group results by quarter in a selected year, your results will look similar to the following:
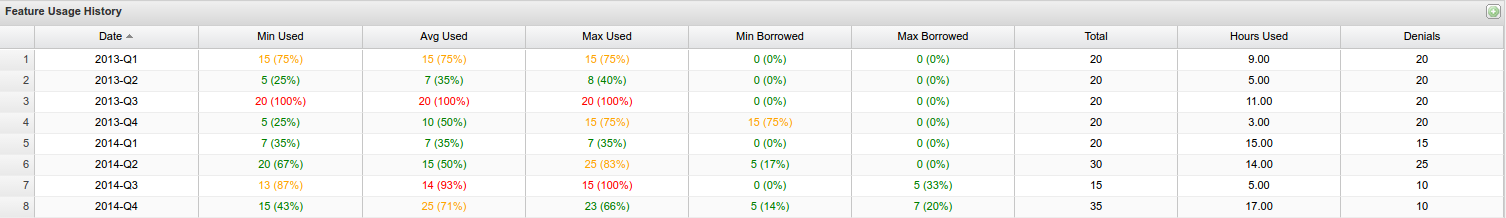
The examples above show usage for the current month.
Average usage calculation
The average usage (Avg Used column value) is computed differently depending on how the usage history data is grouped.
- When data is grouped by Day, the average usage is the weighted average of licenses used in particular day. For example, if you use 1 license for 8 minutes, then use 6 licenses for 2 minutes, the average usage is calculated as (1*8 + 6*2) / (2+8) = 2.
- When data is grouped by Week, the value displayed is the mathematical average of the weighted averages.
...
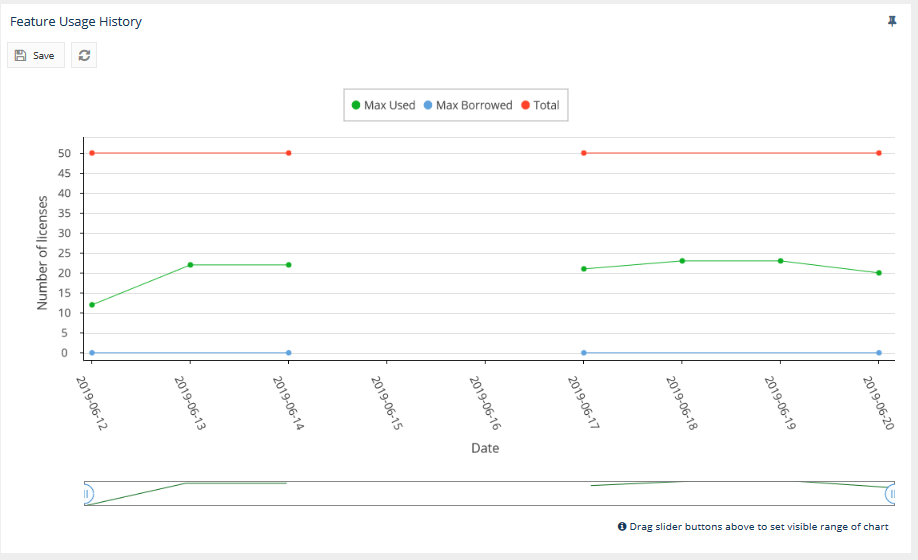
The Feature Usage History grid includes both the number and percentage of minimum, average, and maximum license usage and minimum and maximum borrowed licenses. The grid also includes the total number of licenses for the selected feature, the number of hours at least one license for a particular feature was used and/or borrowed, as well as information about denials.
The color of the text in the license usage columns helps you quickly recognize the level of utilization:
...
Note that if you filter the grid data using the grid columns, those filters will also be used in the graph and when downloading the data to a file. For more information, see see Introduction to using License Statistics pages and and User preferences.
You can add the Feature Usage History grid to the License Statistics Dashboard. Learn more about customizing the Dashboard.
Feature Usage History graph
...
You can hide or show total, used and borrowed licenses. The display of these usage details in the graphs is controlled by clicking the status for which you want to view data in the legend at the top of the chart. For example, clicking the "Max Used" option on the graph legend will remove the lines showing the number of used licenses. The graph below shows the number of borrowed and total licenses, whereas the display of used licenses is hidden (greyed out).
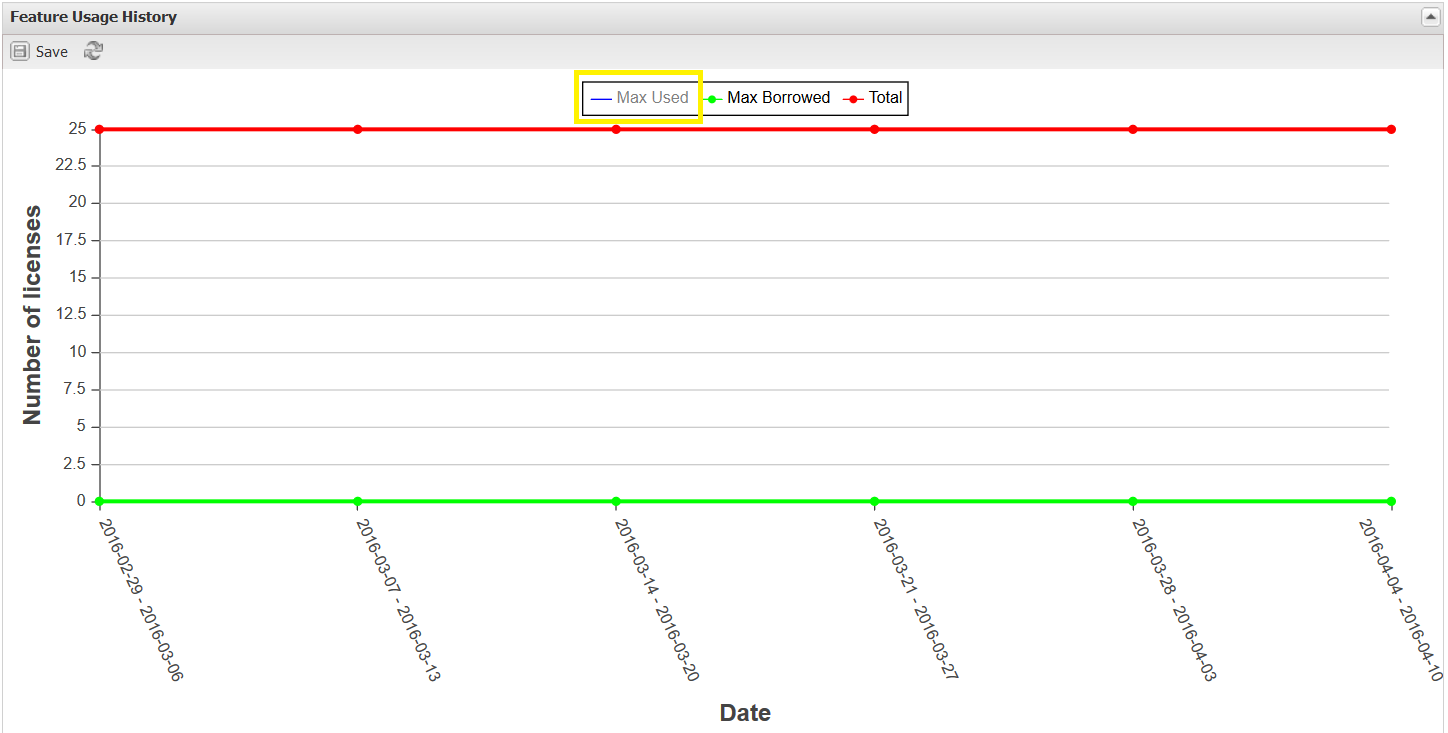
Note: When the Feature Usage History graph is hidden, License Statistics does not have to push the high volume of data that is normally loaded into the chart. Therefore, hiding the display of this graph increases the performance of License Statistics, causing it to run faster.
...