...
The information on this page refers to License Statistics v6.18 20 and newer, which added the ability to view API resources for reports, and added an Expiration Date sub-column to the Feature multi-column for all grids with Featuresimproved color-coding used for license server "last update time" and feature reservations "last active" information to be based on the number of query intervals elapsed since the last successful query. If you are using a version previous to v6.1820, see documentation for previous versions. |
| Info |
|---|
| Customizing License Statistics pages with different colors, graphics, etc. is currently not supported. |
...
Color-coding is also used to indicate the minutes elapsed for license server "last update time" and feature reservations "last active" information to indicate the number of query intervals elapsed since the last successful query:
| Minutes elapsed since last update timeQuery intervals elapsed | Color indicator |
|---|---|
| 0 - 201 | Green |
| 20 1 - 402 | Orange |
| 40 2 or more | Red |
Filtering results in reports
...
| Expand | ||
|---|---|---|
| ||
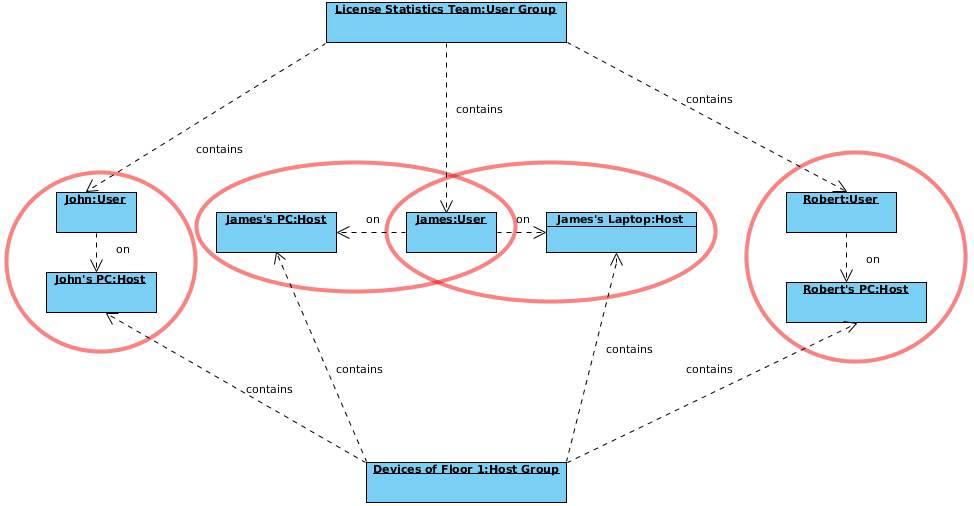
The following diagram shows how License Statistics aggregation options are used by real-world entities in a company. |
Date range
| Info |
|---|
Prior to v6.19, date range settings were static. As of v6.19, all date range settings (other than Custom) are dynamic, as described below. If you added reports with date ranges applied to the Dashboard, you will need to replace those reports to see dynamic date ranges. |
Selections for the date range you want to include in a report differ depending on the report. Date range selections may include:
- Current or Last Year
- Current or Last Quarter
- Current or Last Month
- Current or Last WeekWeek
- Today
- Yesterday
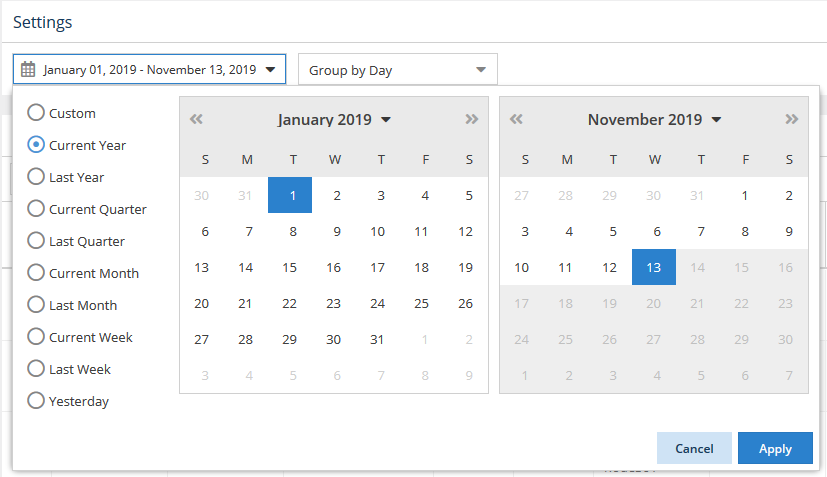
- Custom (which lets you select a specific start and end date from the calendars)
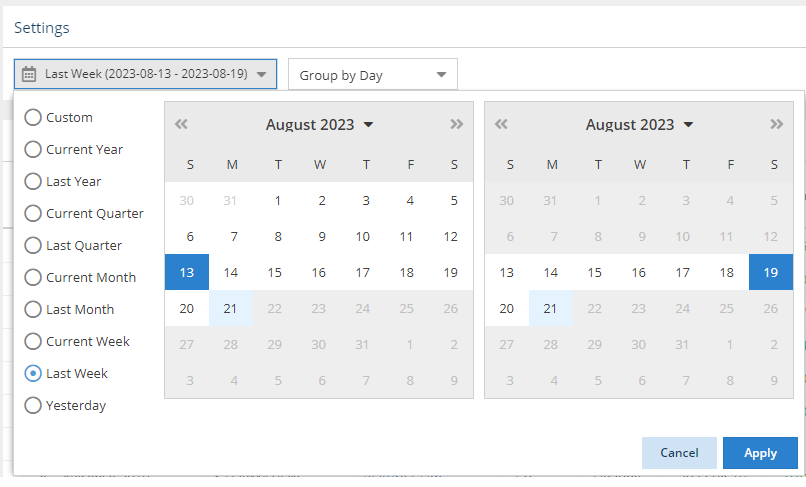
For all selections other than Custom, the range will be set according to the current date, and will adjust dynamically so that the range is always based on the current date, rather than the date upon which the setting was made.
For example, the following illustration shows that the current year has been "Last Week" selected for report results:. The range moving forward will always reflect "last week" according to the current date, rather than the particular dates effective at the time the option was chosen.
Grouping by time units
...
The area between the sliders is like a "window" on the timeline. In the example above, the sliders have been moved to show only the middle part of the chart's timeline.
| Note |
|---|
There are technical limits beyond which the chart cannot be rendered. It will not be visible if any of the conditions are met:
|
Anchor filtering filtering
Sorting and filtering grid content
| filtering | |
| filtering |
...
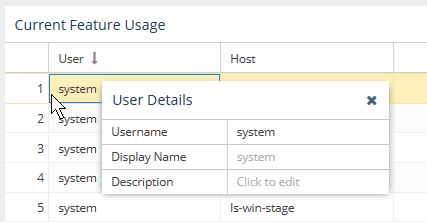
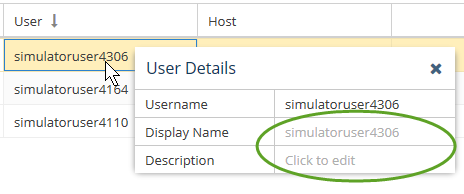
- Hover over the User or Host cell that you want to view or set. A User/Host Details popup will appear.
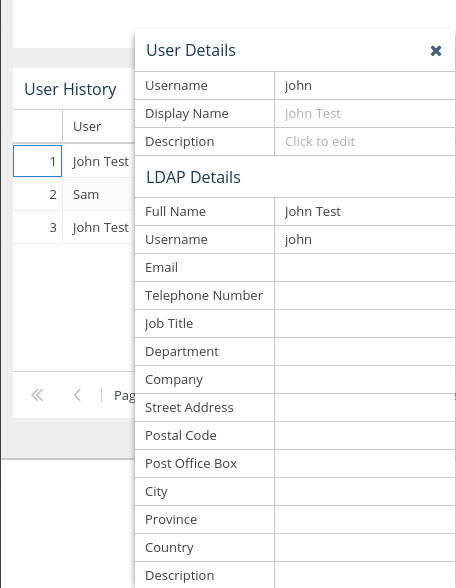
If displaying LDAP usernames is enabled, and data from LDAP was imported, the LDAP display name (shown in the "Full Name" field under LDAP Details) will be used for the username and the popup will include additional LDAP details, as illustrated below. If LDAP data was imported there is a "Full Name" field visible on the popup window. If the checkbox is selected, then this Full Name will be used on grids, until it's overridden by custom Display name - Type the desired text directly into the User/Host Details table's Display Name and/or Description fields (circled in green in the illustration below).
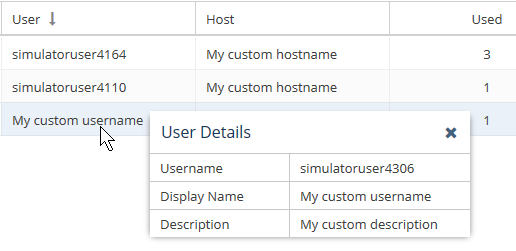
The Display Name you enter will override the default username/hostname and (if applicable) the LDAP username displayed in the grid.
...
