...
The information on this page refers to License Statistics v6.8 12 and newer, which added the ability to sort grid results by multiple columnsmaximize content to full window size. If you are using a version previous to v6.812, see documentation for previous versions. |
License Statistics UI pages are intuitive to work with and include many features that help you quickly find and view the information most important to you, including the following features.
...
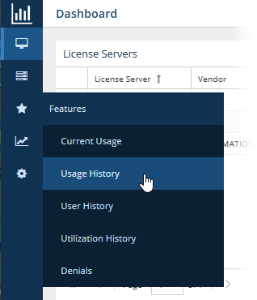
When the navigation pane is collapsed, icons remain so you can still navigate to desired pages:
Expanding content to maximum size
Most content can be expanded to take up the entire License Statistics application window by clicking the expand icon ![]() at the upper right corner of the page. Maximizing the content is particularly useful for viewing reports that have a large amount of data, more easily viewing data on a phone or tablet, or setting the view up for a screen capture.
at the upper right corner of the page. Maximizing the content is particularly useful for viewing reports that have a large amount of data, more easily viewing data on a phone or tablet, or setting the view up for a screen capture.
When you expand content to maximum size, the navigation panel and other content of the page, such as selection controls, will not be visible. To return the page to its normal layout, click the restore icon ![]() at the upper right corner of the page, or press Esc on your keyboard.
at the upper right corner of the page, or press Esc on your keyboard.
Limiting pick list content
...
The Dashboard, License Server, and Features pages include collapsible areas that let you control how much information is displayed on the page at one time. These areas have a collapse/expand arrow on the right side of the title bar. You can collapse/expand these areas by clicking on the collapse/expand arrow or simply by clicking anywhere on the title bar. (You can also expand/collapse the navigation pane as described above.)
| Anchor | ||||
|---|---|---|---|---|
|
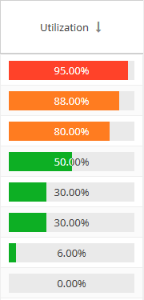
Colors used in graphs and charts help you to immediately see the percentage of licenses being used:
- Red: 90% and above
- Orange: Below 90% and above 70%
- Green: Below 70%
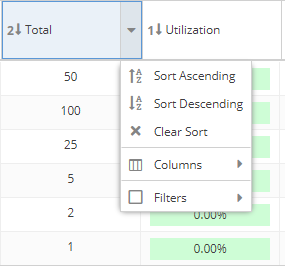
For example, the Utilization column's percentages includes color-coding:
Color-coding is also used to indicate the minutes elapsed for license server "last update time" and feature reservations "last active" information:
| Minutes elapsed since last update time | Color indicator |
|---|---|
| 0 - 10 | Green |
| 10 - 20 | Orange |
| 20 or more | Red |
Filtering results in reports
...
For example, the following illustration shows selecting to group grouping usage information by the day, giving which gives the most detailed results:

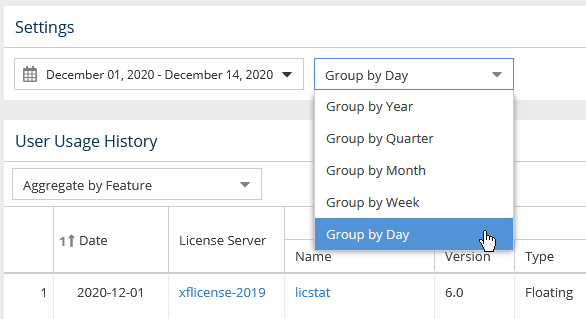
How grouping by a unit of time works in a report
...
The area between the sliders is like a "window" on the timeline. In the example above, the sliders have been moved to show only the middle part of the chart's timeline.
Usage color coding
Colors used in graphs and charts help you to see immediately the percentage of licenses being used:
...
For example, the Utilization column's percentages includes color-coding:
Anchor filtering filtering
Sorting and filtering grid content
| filtering | |
| filtering |
...
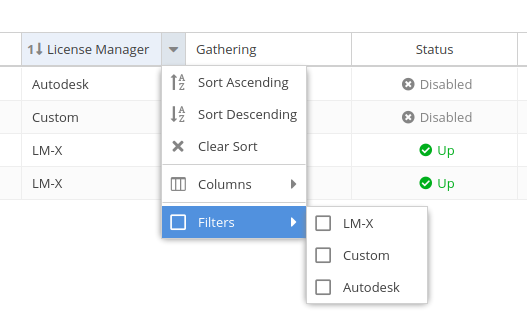
Sorting and filtering controls are accessible by hovering over the column heading and then clicking on the arrow that appears at the right side of the column heading.
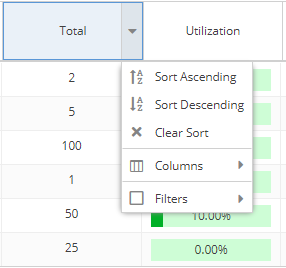
A drop-down menu gives you the following options for viewing the grid contents:
- Sort by selected columns in ascending/descending order (see "Sorting" below for more information).
- Hide/show columns (select the Columns option, then toggle the list of columns on/off). Some columns are hidden by default, as described in "Hidden columns," below.
- Limit the grid contents (select Filters and then select the available options, or enter text for text fields).
- For license managers, you can filter by type:
- Use the settings at the bottom of the grid to select pages to view and control the number of rows to display per page (20 - 1000).
- The filters you apply and the number of rows you select to display in the grid will also be used when downloading the data to a file. For some pages, these settings are also used in the graph content.Use the settings at the bottom of the grid to select pages and control the number of rows to display per page (20 - 1000).
Anchor Sorting Sorting
Sorting
| Sorting | |
| Sorting |
When sorting grid content by columns:
- Grids may be sorted by any column by simply clicking on the column titleheader. Clicking the column header again will toggle between ascending/descending sort order. You can also use the Sort Ascending and Sort Descending options in the column header drop-down menu.
- You can sort by up to three columns. The sort order is indicated by a number to the left of the column heading label.
- You can remove the sort from a column by clicking "Clear Sort" in the column header drop-down menu.
Anchor HiddenColumns HiddenColumns
Hidden columns
| HiddenColumns | |
| HiddenColumns |
Some grid columns, such as "ID" and "Description," are hidden by default. Hidden columns can be shown by toggling them on in the Columns list.
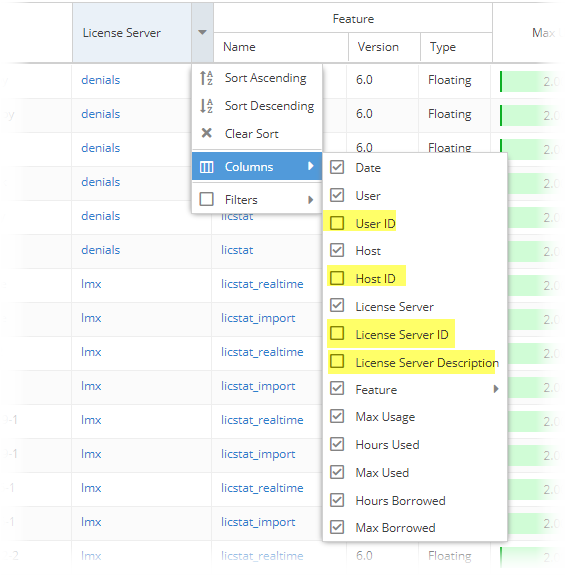
ID and Description columns exist and are hidden by default for the following columns:
- Feature
- License Server
- License Server Group
- User
- User Group
- Host
- Host Group
In addition, grids that include a "Host" column also include a "Host IP" column that is hidden by default.
Refreshing data in grids and charts
...
Throughout License Statistics pages, some user settings persist. As you move from tab to tab and when you close and reopen License Statistics, the settings you make will remain. For example, if you collapse the "Select License Server and Feature," "Advanced Filtering," and "General Information" panels in one tab of the Features page, these panels will still be collapsed in other tabs and the next time you log into License Statistics.
...