...
The information on this page refers to License Statistics v6.18 19 and newer, which added the ability to view API resources for reports, and added an Expiration Date sub-column to the Feature multi-column for all grids with Featuresimproved the behavior for setting date ranges for reports. If you are using a version previous to v6.1819, see documentation for previous versions. |
| Info |
|---|
| Customizing License Statistics pages with different colors, graphics, etc. is currently not supported. |
...
| Expand | ||
|---|---|---|
| ||
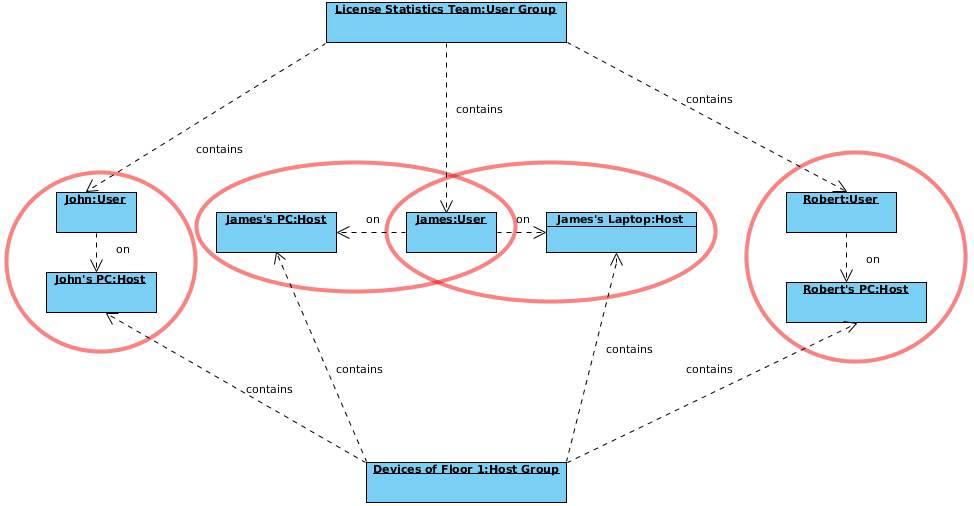
The following diagram shows how License Statistics aggregation options are used by real-world entities in a company.
|
Date range
| Info |
|---|
Prior to v6.19, date range settings were static. As of v6.19, all date range settings (other than Custom) are dynamic, as described below. If you added reports with date ranges applied to the Dashboard, you will need to replace those reports to see dynamic date ranges. |
Selections for the date range you want to include in a report differ depending on the report. Date range selections may include:
- Current or Last Year
- Current or Last Quarter
- Current or Last Month
- Current or Last WeekWeek
- Today
- Yesterday
- Custom (which lets you select a specific start and end date from the calendars)
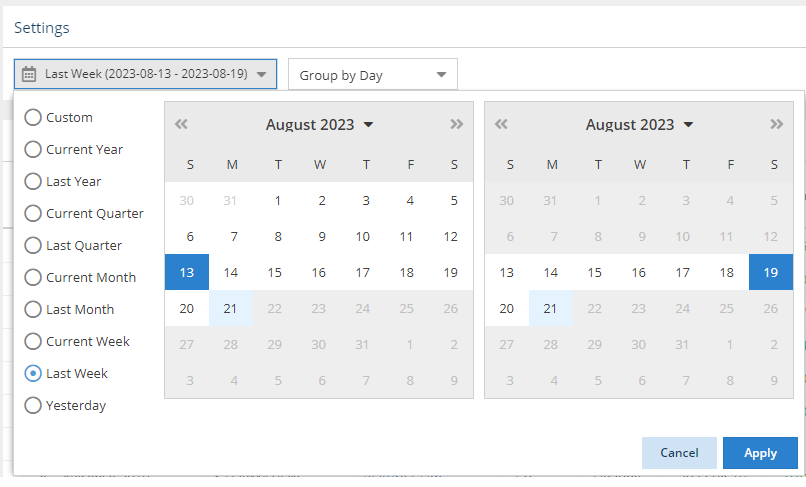
For all selections other than Custom, the range will be set according to the current date, and will adjust dynamically so that the range is always based on the current date, rather than the date upon which the setting was made.
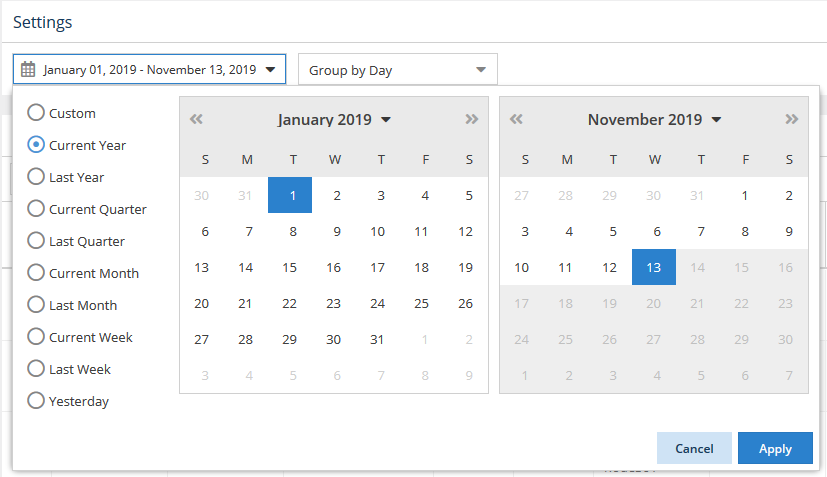
For example, the following illustration shows that the current year has been "Last Week" selected for report results:. The range moving forward will always reflect "last week" according to the current date, rather than the particular dates effective at the time the option was chosen.
Grouping by time units
...