...
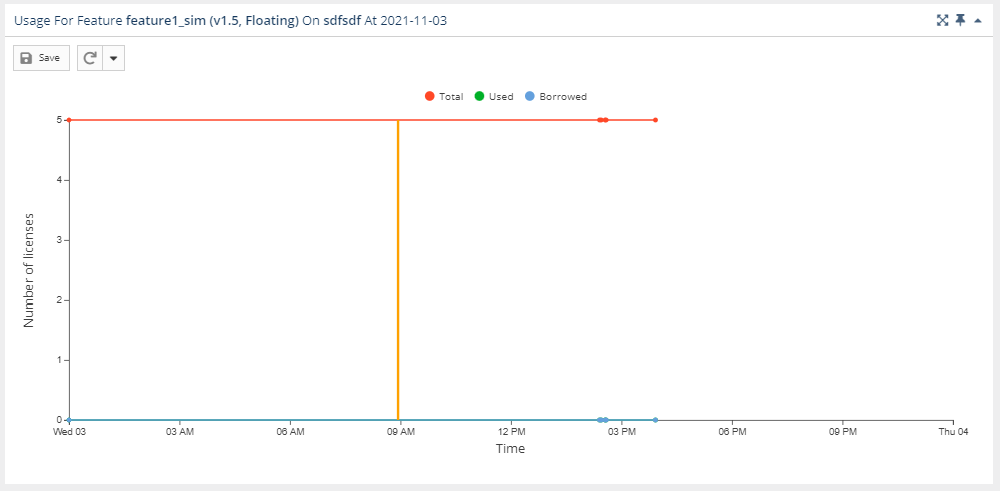
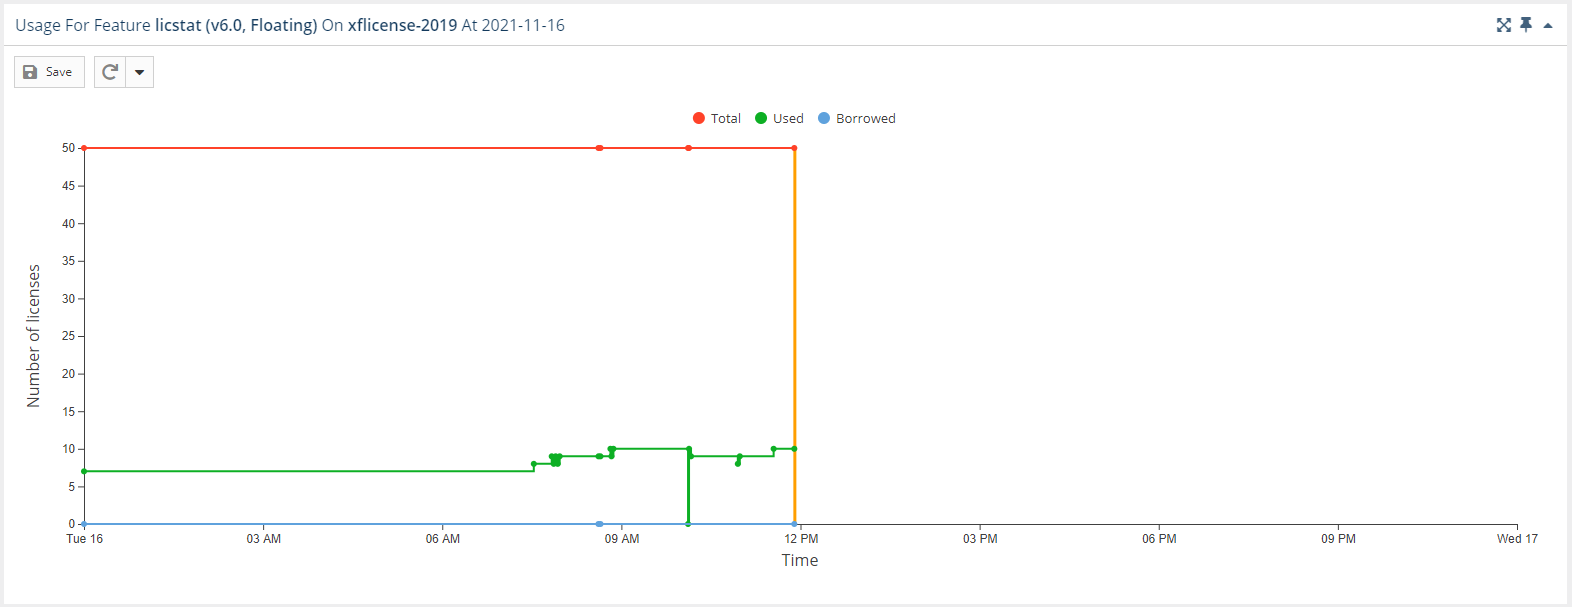
The graph below displays the number of borrowed and used licenses; the display of total licenses is hidden (grayed out). A vertical line (the orange line in the illustration below) shows the current time.
Need better illustration that shows varying utilization percentages – also need to replicate the example above (or change the example).
Features Realtime Usage grid
...
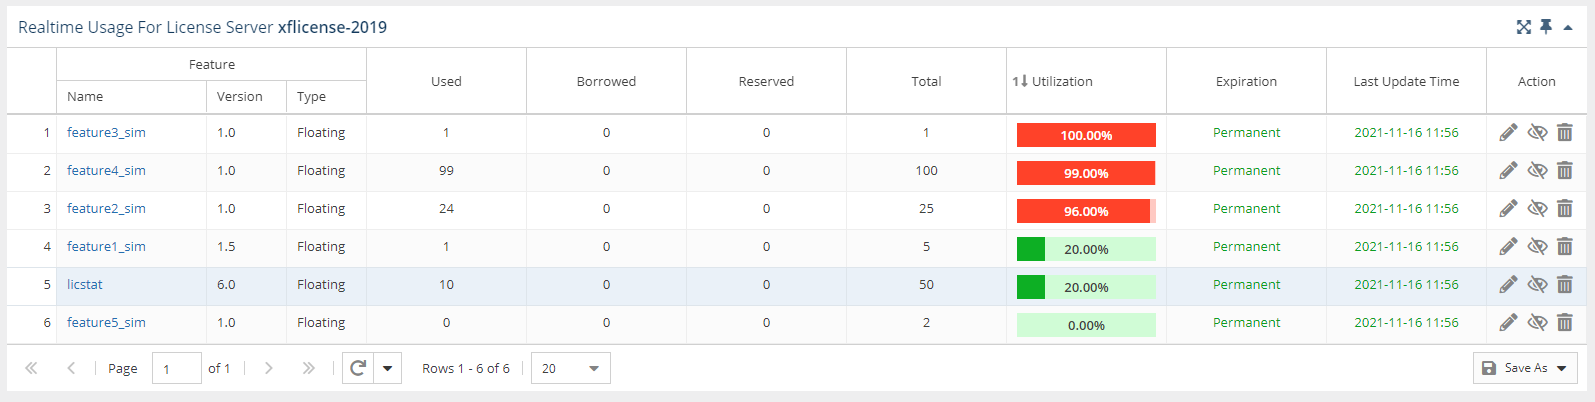
For each feature, you can see how many licenses are in use, borrowed, and reserved; the total number of licenses; percentage of utilization; license expiration date; and the last update time, as shown below. For the new licensing model only, when the Reserved value is greater than 0, the Reserved column includes a link to the Feature Reservations page.
Need better illustration that shows varying utilization percentages
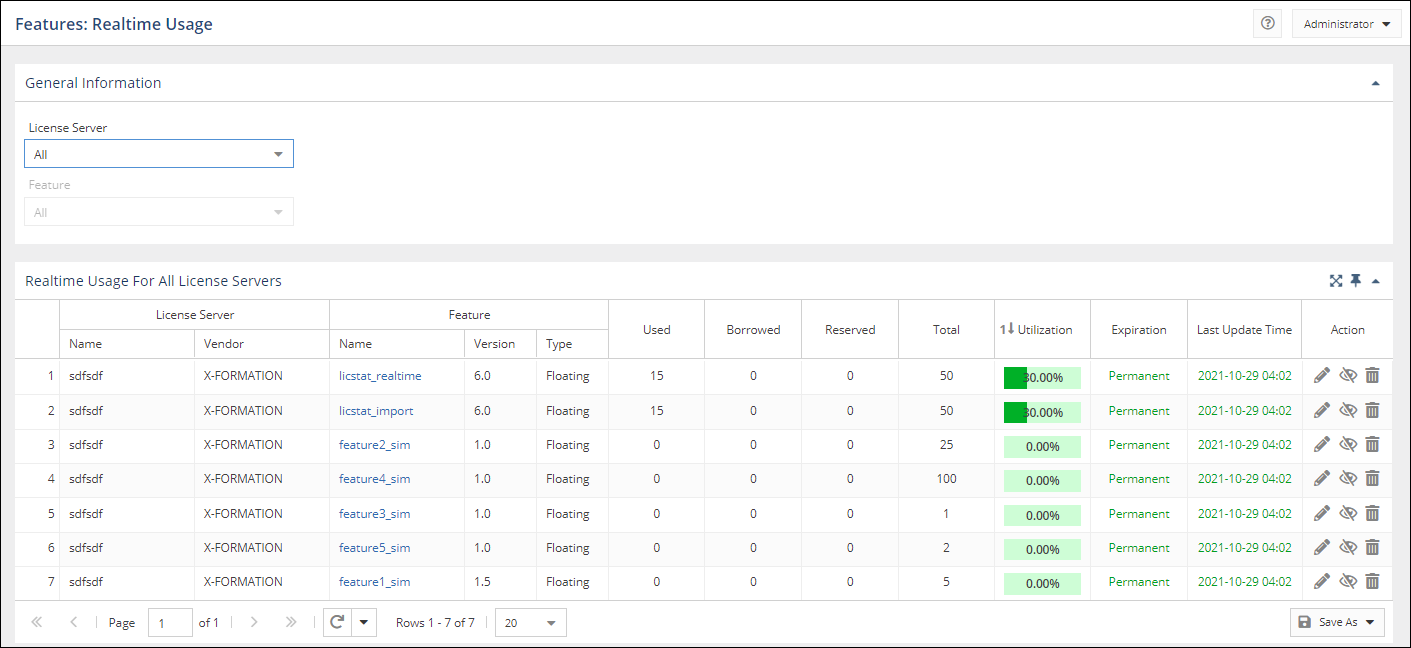
Note: Features that are not current (that is, had no usage reported in the last query interval performed by the license server) are not included in this report. Therefore, expired features won't be shown in this report unless they have current usage (some license servers may allow use of currently checked out features even after those features have expired).
...