...
The Usage page under the Features: Realtime section in the left navigation pane shows information about the license server and its features.
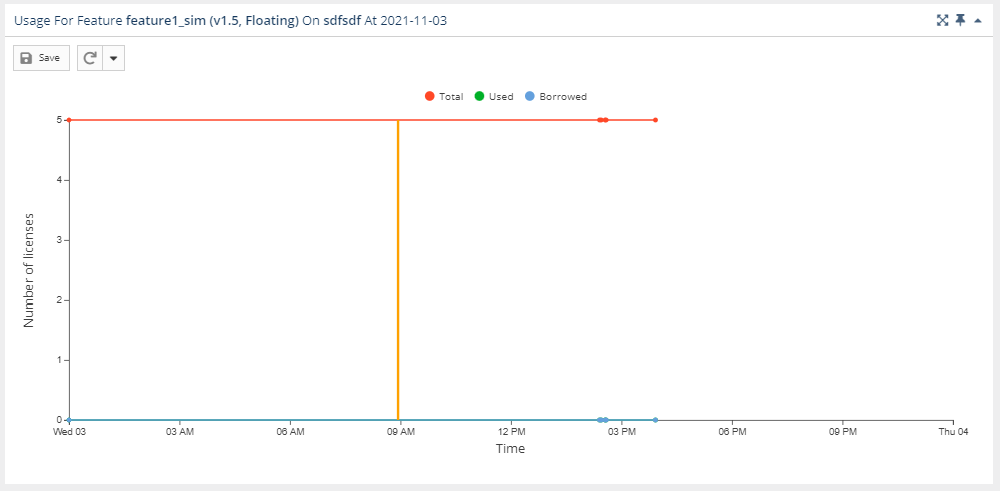
Feature Usage graph
The Feature Usage graph gives you a visual picture of the number of licenses used throughout the day. (See NEW:Feature usage graphs for additional information about feature usage graphs.)
You can hide or show total, used and borrowed licenses. The display of these usage details in the graphs is controlled by clicking the status for which you want to view data in the legend at the top of the chart. For example, clicking the "Total" option on the graph legend will remove the lines showing the number of used licenses.
The graph below displays the number of borrowed and used licenses; the display of total licenses is hidden (grayed out). A vertical line (the orange line in the illustration below) shows the current time.
Need better illustration that shows varying utilization percentages
License Server Current Usage grid
...