...
The information on this page refers to License Statistics v6.15 24 and newer, which added "Available" license count to removed the Action column from the Features Realtime Usage report. grid, and changed the column label "Utilization (%)" to "Used (%)." If you are using a version previous to v6.1524, see documentation for previous versions. |
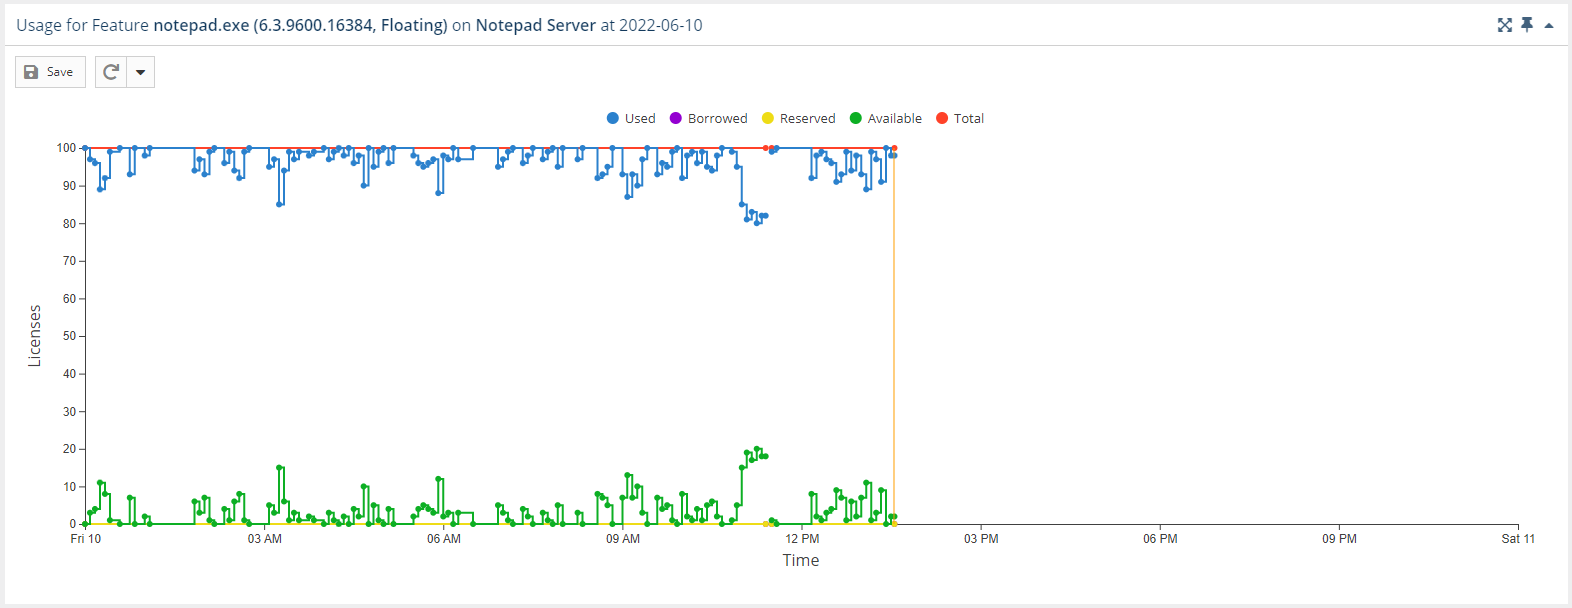
The Usage page under the Features: Realtime section in the left navigation pane shows information about the license server and its features.
...
You can toggle the visibility of graph lines for used, borrowed, reserved, total, and available licenses by clicking the relative items in the legend at the top of the chart. For example, clicking "Total" on the graph legend will hide/show the graph lines for the total number of licenses.
Features Realtime Usage grid
...
For each feature, you can see how many licenses are in use, borrowed, and reserved; total number of licenses; number of licenses that are available (total licenses minus the number of used and reserved licenses) and unavailable; percentage of utilizationusage; license expiration date; and last update time. For Licensing Model 2019 only, when the Reserved value is greater than 0, the Reserved column includes a link to the Feature Reservations page.
| Note |
|---|
...
Features that are not current (that is, had no usage reported in the last query interval performed by the license server) are not included in this report. Therefore, expired features won't be shown in this report unless they have current usage (some license servers may allow use of currently checked out features even after those features have expired). |
How License Statistics counts licenses
...


