...
The information on this page refers to License Statistics v6.7 10 and newer, which introduced redesigned the ability to zoom into areas on the heat map chart (available only with the new licensing model)General Information area to include LDAP details (removing the separate LDAP details area) and toggle display of matching cloud users, and added a Cloud Users grid. If you are using a version older than 6.710, see documentation for previous versions. |
To see a report on usage history for a specific user/user group, select the Usage History page under the Users section in the left navigation pane. You can add the Usage History grid and graph to the License Statistics Dashboard. Learn more about customizing the Dashboard.
...
The General Information area lets you select the user/user group for which to view usage history and displays details for that user, including matching cloud users, if applicable.
Filtering results
The Settings panel above the grid lets you filter results.
...
The heat map format looks like the following example:

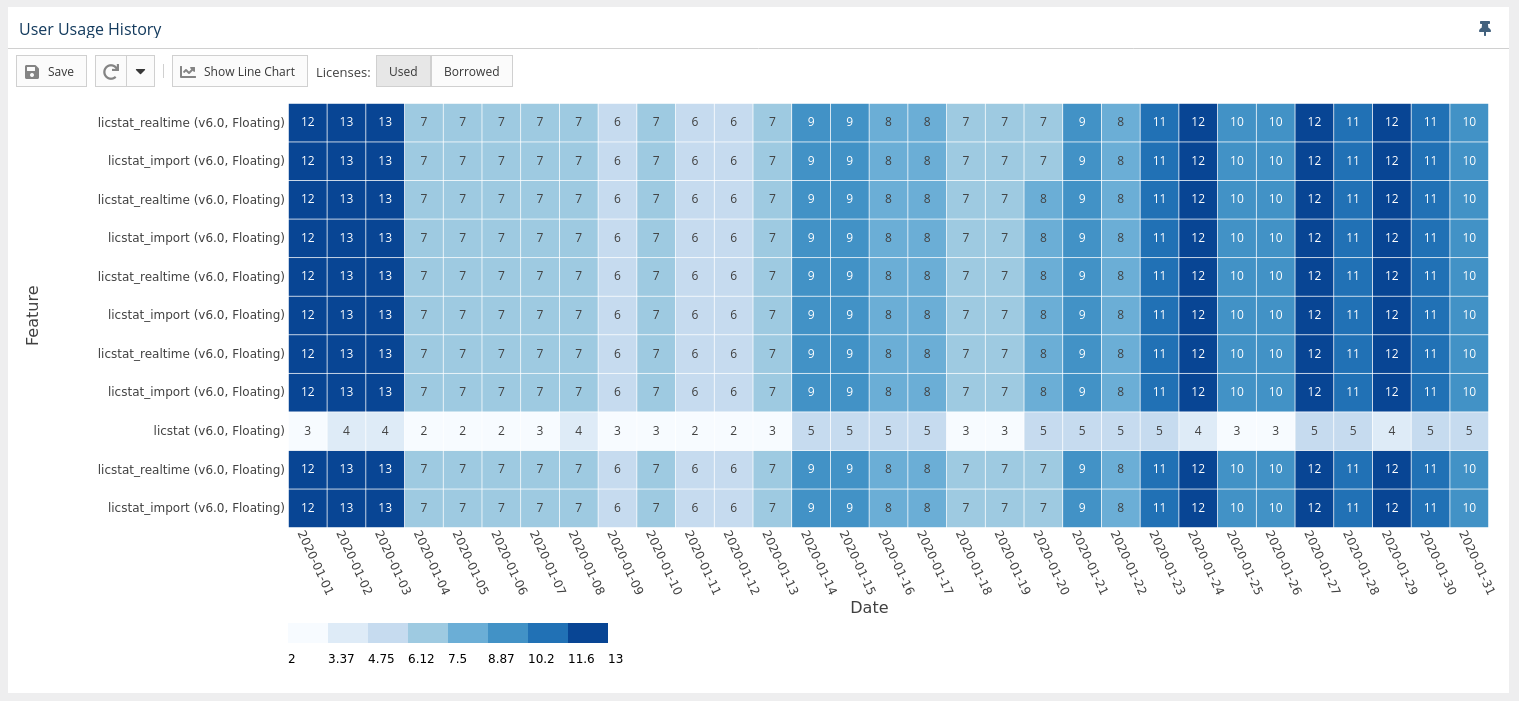
In the heat map version of the chart:
...