...
You can select individual license servers/features to view data for, or choose to view data for all license servers/features.
Checkout Denials grid
The Checkout Denials grid shows the User and Host for each denial and the time the denial took place. The data is presented in a grid format and as a chart, making it easy to quickly understand and analyze information you need.
You can adjust the settings in the Settings panel to include only the results that are important to you by choosing the dates and the time periods the dates and the time periods by which denials are grouped (hour, day, week, month, quarter, or quarter) by which denials are grouped from the Settings panelyear). You can also aggregate by License by License Server, Feature, Username, or Hostname.
Checkout Denials chart
The Checkout Denials chart gives you a visual of the number of denials that occurred for the selected feature during the chosen time period.
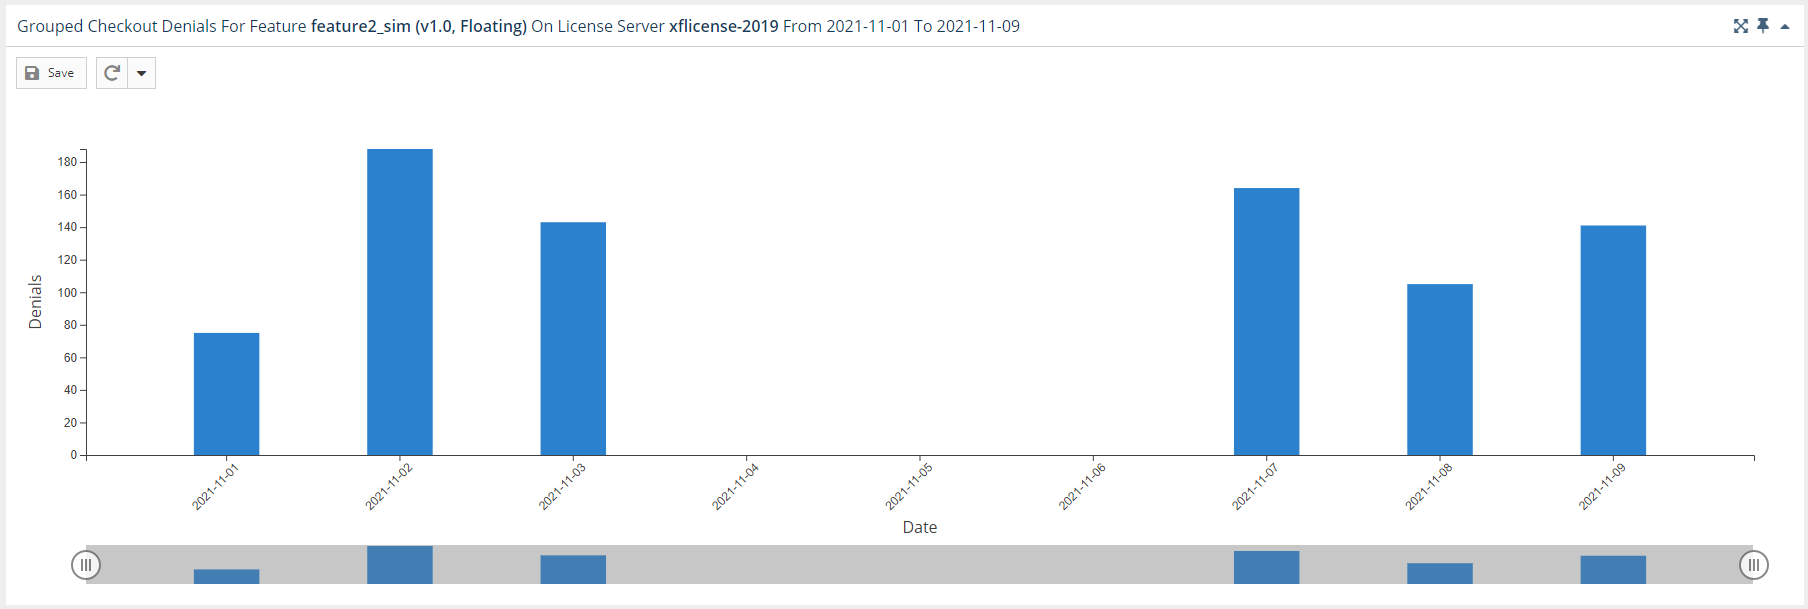

You can add the Checkout Denials chart to the License Statistics Dashboard. Learn more about customizing the Dashboard.
Checkout Denials grid
The Checkout Denials grid shows the User and Host for each denial and the time the denial took place.
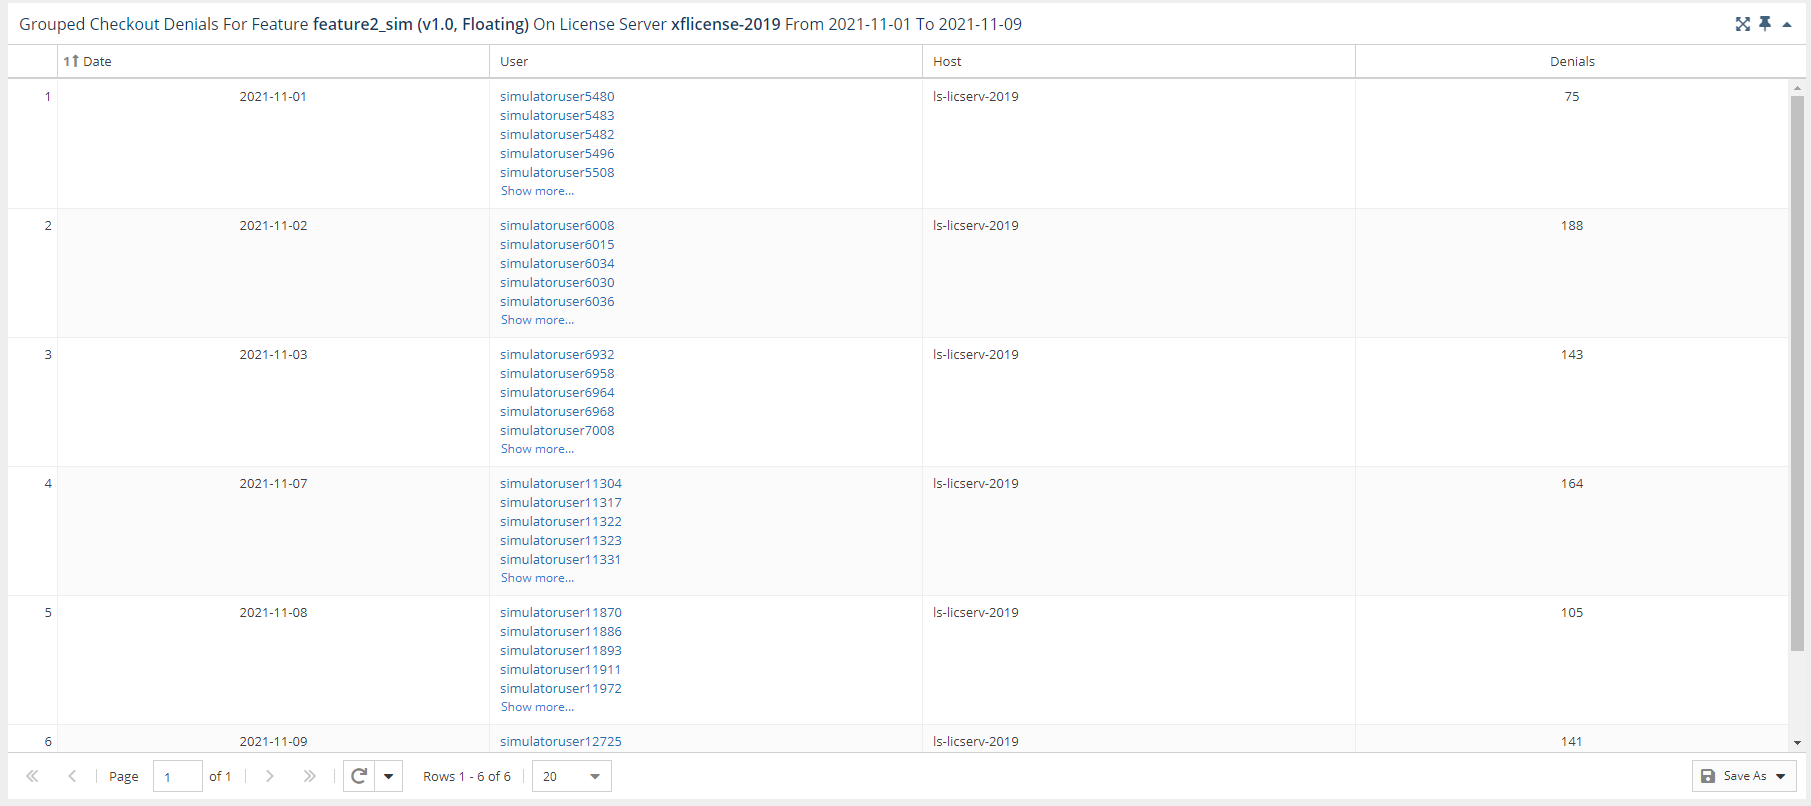
You can add the Checkout Denials grid and chart to the License Statistics Dashboard. Learn more about customizing the Dashboard.