...
As shown in the example below, the amount of utilization drops consistently with the number of simultaneously used licenses.

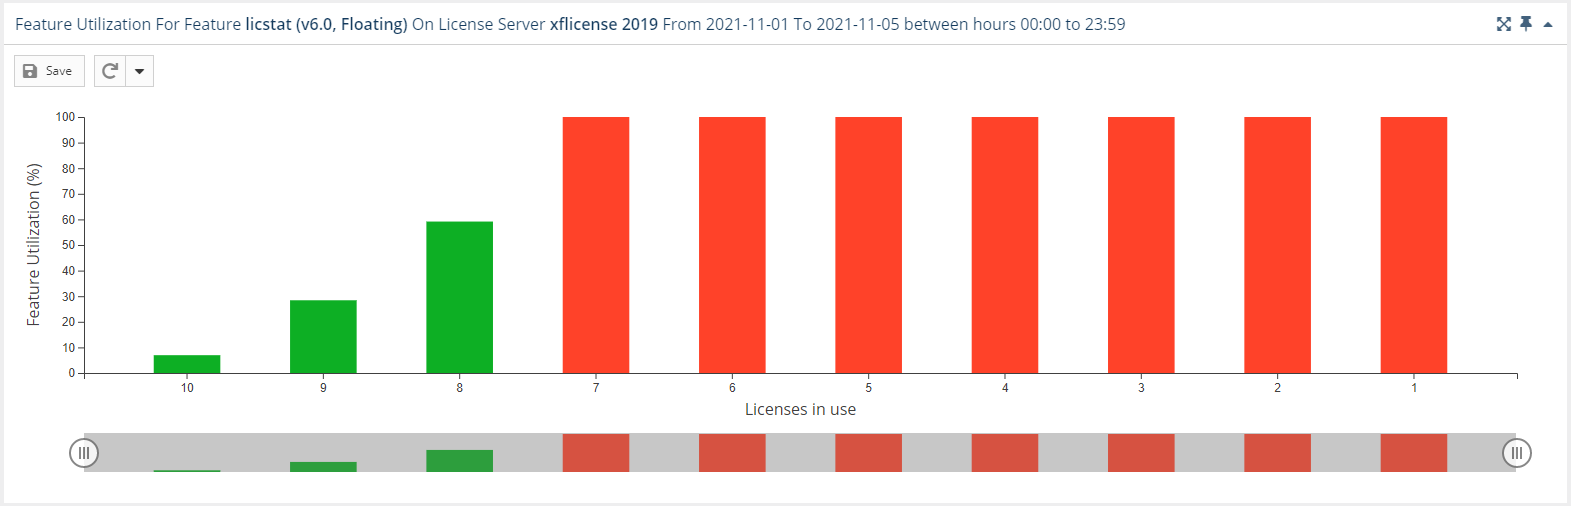
You can add the Utilization History graph to the License Statistics Dashboard. Learn more about customizing the Dashboard.
...
The Feature Utilization grid shows license usage based on how many licenses were used for how long and the percentage of utilization for those licenses.
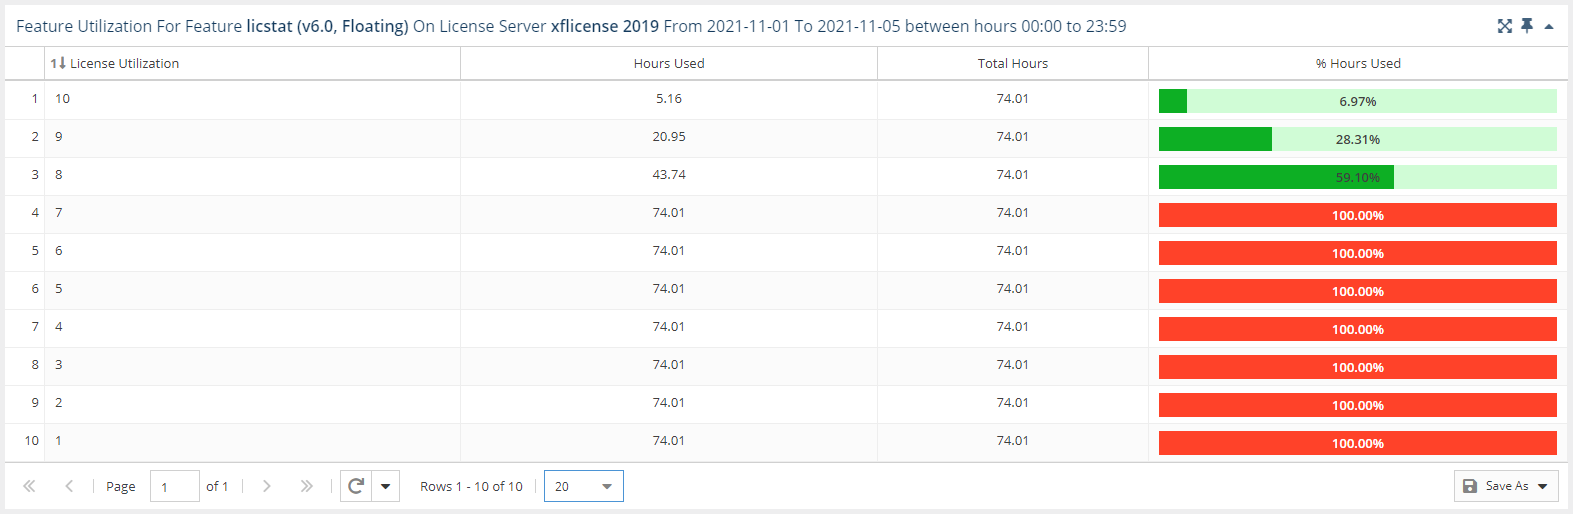

The calculation for determining the percentage of hours used is as follows:
...