...
License Statistics UI pages are intuitive to work with and include many features that help you quickly find and view the information most important to you, including . Basic information about working with the License Statistics UI is described in the following featuressections.
Navigation
Navigation is done using the left pane of the application window. Click on the arrows to expand/collapse sections and click on items under the sections to switch to that page. The following illustration shows switching to the "Features: Usage History" page.
...
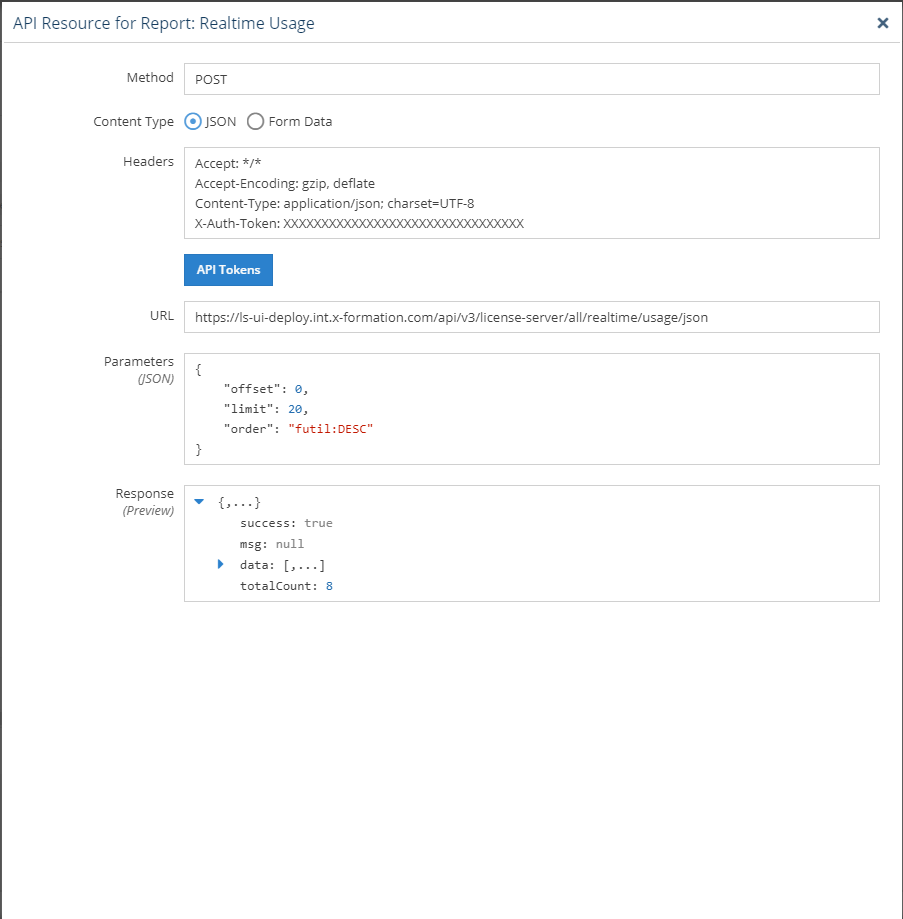
After clicking this icon, an API Resource window opens, with details of the API request used to generate the report, including the headers, endpoint and used parameters. You can use this information to facilitate integration with other tools, such as PowerBI, Excel or any other application that you want to allow to access the License Statistics data.

Limiting pick list content
...
Sorting and filtering controls are accessible by hovering over the column heading and then clicking on the arrow that appears at the right side of the column heading.
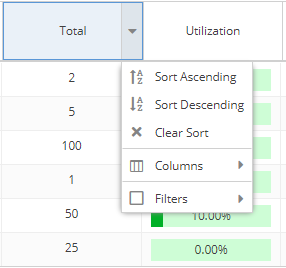

A drop-down menu gives you the following options for viewing the grid contents:- Sort by selected columns in ascending/descending order (see "Sorting" below for more information).
- Hide/show columns (select the Columns option, then toggle the list of columns on/off). Some columns are hidden by default, as described below.
- Limit the grid contents (select Filters and then select the available options, or enter text for text fields).
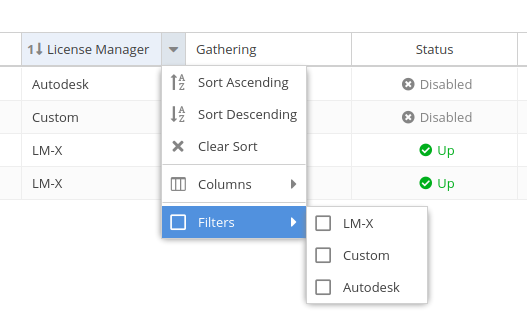
- For license managers, you can filter by type:
- Use the settings at the bottom of the grid to select pages to view and control the number of rows to display per page (20 - 1000).
- The filters you apply and the number of rows you select to display in the grid will also be used when downloading the data to a file. For some pages, these settings are also used in the graph content.
...
- Grids may be sorted by any column by simply clicking on the column header. Clicking the column header again will toggle between ascending/descending sort order. You can also use the Sort Ascending and Sort Descending options in the column header drop-down menu.
- You can sort by up to three columns. The sort order is indicated by a number to the left of the column heading label.
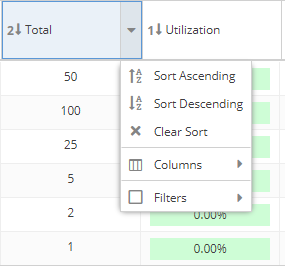

- You can remove the sort from a column by clicking "Clear Sort" in the column header drop-down menu.
...
Column visibility
Feature and user reports share some common content, such as license server name, feature name, and so on. To make reports less cluttered and easier to read, some grid columns are hidden by default across all reports that contain those columns, such as "ID" and "Description," . Controlling column visibility and default visibility settings are described below.
Controlling column visibility
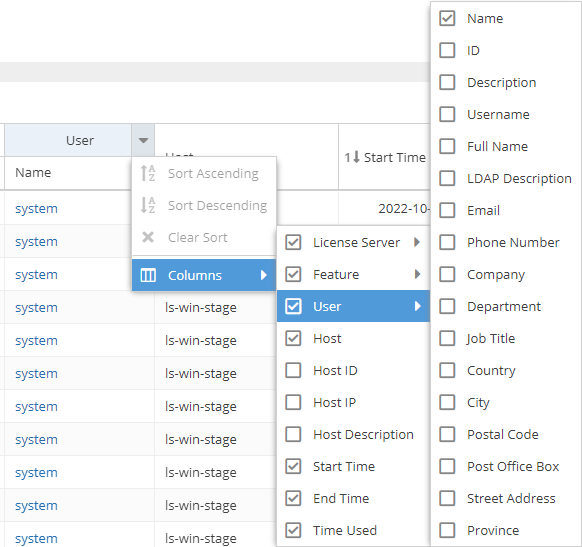
You can toggle visibility of columns by selecting the Columns option under the column header's drop-down menu, as illustrated below for the User column.
Anchor HiddenColumns HiddenColumns
Common grid columns and default visibility settings
| HiddenColumns | |
| HiddenColumns |
To make reports less cluttered and easier to read, some grid columns are hidden by default across all reports that contain those columns, as . Default visibility settings are detailed in the following table.
| License Server |
|---|
...
| , Feature, Host and User details | ||
|---|---|---|
| Column | Sub-columns/associated columns | Hidden Visible by default |
| License Server | Name | |
| Vendor |
| |
| Manager | ||
| ID | ||
| Description | ||
| Feature | Name | |
Version | ||
Type | ||
| Collection | ||
| ID | ||
| Description | ||
| Expiration Date | ||
| Host | Host IP Name | |
Hostname | ||
| Host ID | ||
IP Address | ||
| Host Description | ||
| Host Quantity | ||
User (includes all LDAP data) | Name | |
| ID | ||
| Description | ||
Username | ||
| Full Name | ||
| LDAP Description | ||
| Email | ||
| Phone Number | ||
| Company | ||
| Department | ||
| Job Title | ||
| Country | ||
| City | ||
| Postal Cod | ||
| Country | ||
| City | ||
| Postal Cod | ||
| Post Office Box | ||
| Street Address | ||
| Province | ||
You can toggle visibility of columns by selecting the Columns option under the column header's drop-down menu, as illustrated below for the User column.
Refreshing data in grids and charts
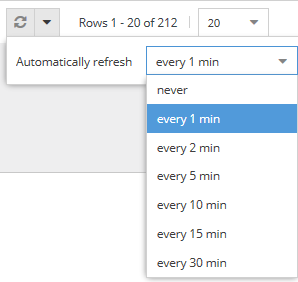
You can refresh data at any time by clicking on the Refresh icon at the bottom of grids and charts.
![]()
Clicking on the arrow next to the Refresh icon lets you set the automatic refresh interval, which is 1 minute by default.
...
| Post Office Box | ||
| Street Address | ||
| Province | ||
| Usage details | ||
|---|---|---|
| Column | Sub-columns/associated columns | Visible by default |
| Used | Min | |
Min (%) | ||
Avg | ||
Avg (%) | ||
Max | ||
Max (%) | ||
Duration | ||
| Duration (%) | ||
| Borrowed | Min | |
Min (%) | ||
Max | ||
Max (%) | ||
Duration | ||
Duration (%) | ||
| Reserved | Min | |
Min (%) | ||
Max | ||
Max (%) | ||
| Available | Min | |
Min (%) | ||
Max | ||
Max (%) | ||
Viewing and setting User/Host details
...
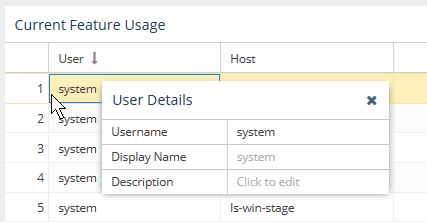
- Hover over the User or Host cell that you want to view or set. A User/Host Details popup will appear.
If displaying LDAP usernames is enabled, and data from LDAP was imported, the LDAP display name (shown in the "Full Name" field under LDAP Details) will be used for the username and the popup will include additional LDAP details, as illustrated below. If LDAP data was imported there is a "Full Name" field visible on the popup window. If the checkbox is selected, then this Full Name will be used on grids, until it's overridden by custom Display name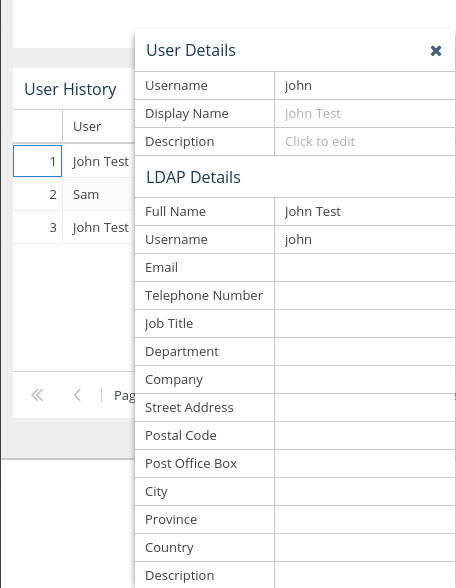
- Type the desired text directly into the User/Host Details table's Display Name and/or Description fields (circled in green in the illustration below).
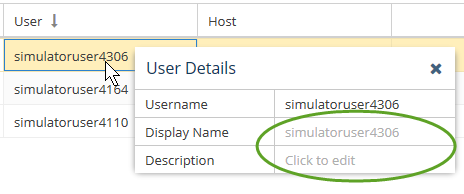
The Display Name you enter will override the default username/hostname and (if applicable) the LDAP username displayed in the grid.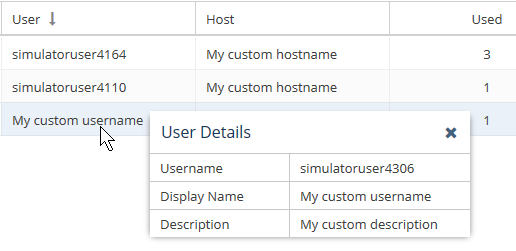
Refreshing data in grids and charts
You can refresh data at any time by clicking on the Refresh icon at the bottom of grids and charts.
![]()
Clicking on the arrow next to the Refresh icon lets you set the automatic refresh interval, which is 1 minute by default.
Persistent page settings per user
...